MEGSIM MEGAN //
MEGAN: A Software Package for MEG and EEG Analysis & Visualization
Neural ElectroMagnetic (NEM) methods, (MEG and EEG) allow noninvasive study of neuronal activity in the brain by measuring the magnetic field outside the head or the electric potential on the scalp. For decades EEG (and more recently MEG) have been employed for investigating the temporal dynamics of neural population activity. The more recent use of NEM techniques for localizing current sources within the brain creates additional technical and analytical requirements. We have developed the software package MEGAN in response to the requirements for reliable signal processing, data visualization, source localization and temporal analysis capabilities, and a convenient user interface, with the intent to make it available to the brain mapping community. MEGAN can be downloaded from the Mind Research Network web site.
System Capabilities: MEG/EEG data comes in a variety of formats, depending upon the sensor system that was used, on the form in which the data was saved, and on the type of experiment that was done. MEGAN currently handles MEG and EEG data from Neuromag and CTF native formats and 4D saved in fif format. It accepts user-written modules to read data from other systems. It supports both continuous and averaged evoked response data. Continuous data may consist of spontaneous activity or may contain embedded sensory or behavioral responses; MEGAN provides capability for retrospective averaging relative to a stimulus or response record. MEGAN provides a variety of visualization options for selecting epochs of spontaneous data, data conditioning, and viewing of the data. All of the forms of data that MEGAN handles can be written to our standard netMEG file, a flexible, extensible, self-documenting, and highly portable file, written using the netCDF format. Code to read the netMEG file into programs written in C and IDL can be downloaded from the Mind Research Network web site. There are MATLAB toolboxes to support reading netCDF files. MEGAN is written in IDL and can be run without an IDL license using the IDL Virtual Machine.
MEGAN emphasizes signal processing because NEM data is especially vulnerable to noise contamination, both from the subject's own body and from environmental sources, such as the 60 Hz AC power signal. A variety of sensor designs, hardware filters, and shielding are used to reduce recorded noise, but digital filtering and artifact rejection in post-processing are also useful. MEGAN offers a great deal of flexibility and user control in signal processing, with options tailored to each type of data, as well as general, highly configurable signal processing routines, and the ability to call user-supplied routines. Capabilities for Fourier analyses are provided, both for analysis of oscillatory activity and as tools for digital filtering. MEGAN is an event-driven program, with the user controlling the flow of processing by means of a point and click graphical user interface. It can also be run in batch mode using an automatically developed script. NEM experimental designs often employ many resolvable variations of a stimulus or behavioral response during a single experimental session. MEGAN allows these cases to be analyzed separately using the same processing stream, in order to facilitate comparisons between experimental conditions.
A few examples of MEGAN screens follow, illustrating the major areas of MEGAN functionality: signal processing and data visualization.
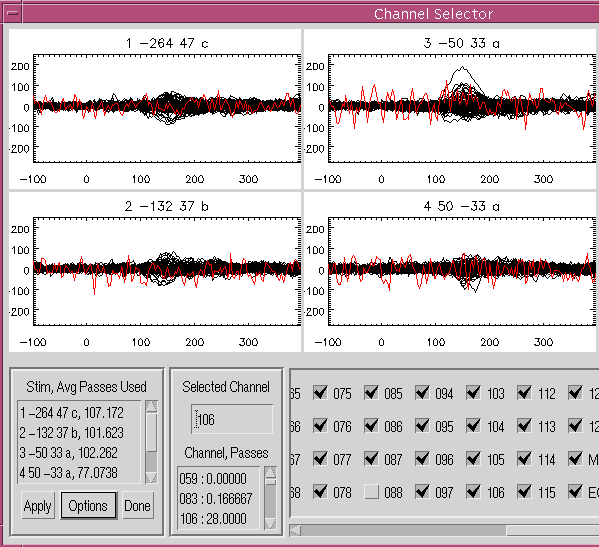
The Channel Selector is a user interface for finding and inactivating bad channels. The data shown here is from an MEG visual evoked response study done on the Neuromag whole head system. Each subplot displays the signal for one stimulus condition from all channels. The user has clicked on a questionable waveform in one plot, and the corresponding waveforms in all of the subplots have been highlighted. The "Selected Channel" box indicates that the selected waveform is from Channel 106, and the "Channel Passes" list shows that, on average, only 28 epochs from this channel survived the artifact rejection process for each stimulus condition. The "Stimulus, Averaged Passes Used" list to the left, shows that there were originally at least 77 epochs of data for each stimulus condition. The data from channel 106 can be inactivated by clicking the button next to its name on the lower right.
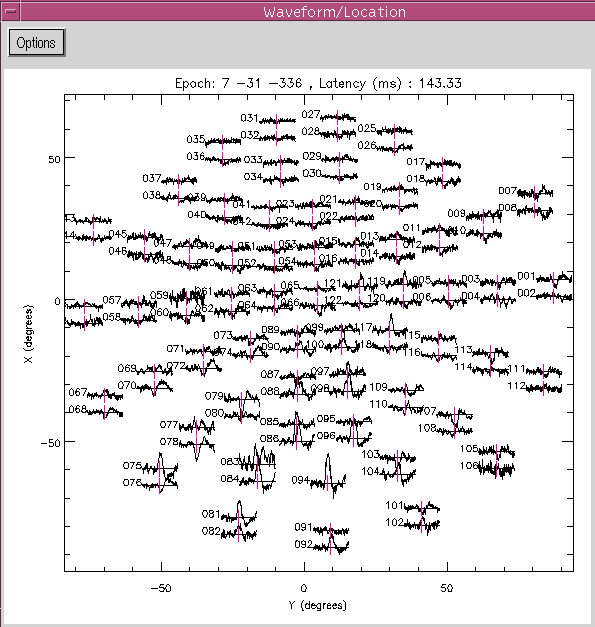
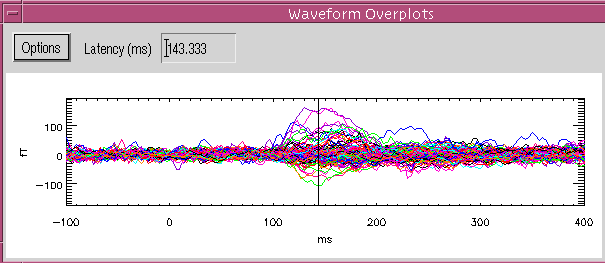
The Waveform Location and Waveform Overplots windows are shown above. In the Waveform Location window, each waveform is plotted starting from the location of its sensor, projected onto a plane. A variety of projection methods are available; in this case, the user has selected the azimuthal equidistant projection, which shows the entire surface, flattened out. We are looking down upon the head; the subject's nose would be at the top of the plot. The data is from the Neuromag system, which has a pair of planar gradiometers at each location. The user has chosen the option to use a vertical offset to separate the pairs of waveforms from collocated sensors. The Waveform Location window is a graphical user interface which enables the user to click on waveforms to inactivate them or to select channels of data to display in the Waveform Overplots window.The Waveform Overplots window, which shows selected waveforms plotted on the same axis, is useful for determining the onset and duration of the response or spike, and for seeing the maximum and minimum amplitudes. Clicking in the Overplots window will select a waveform or, as shown in this example, a time slice. A vertical marker appears at the selected time on each waveform in the Waveform Location window, and the contour plot for that time slice can be displayed. If waveform mode were selected, the selected waveform would be highlighted in both the Overplot and Waveform Location windows.
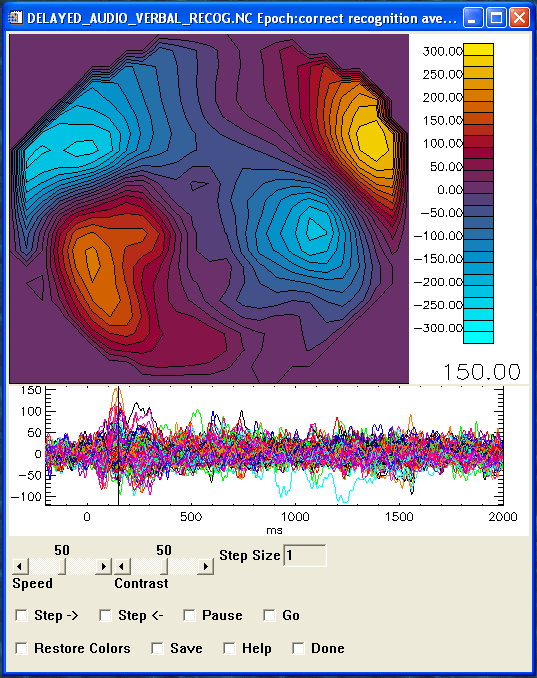
MEGAN's contour movie window displays the magnetic field or electric potential varying over time. The user chooses the time interval by clicking in the waveform plot. The vertical line in the waveform plot indicates the time of the frame that is displayed. The user can step through the movie to view individual frames, and can control the speed of the movie. The movie can be saved as an MPEG file. The data is from a delayed auditory verbal recognition study done on a Neuromag 122 system. A list of words was presented in two lexical decision tasks. Then after a 20 minute delay, a larger list of words (some old and some new) was presented and volunteers were asked if the word was one they just heard previously (yes or no).
Contact
ElaineBest@[nospam]gmail.com

